RollerCon 2019 Demographics
Updated February 2019
New Questions, New Data!
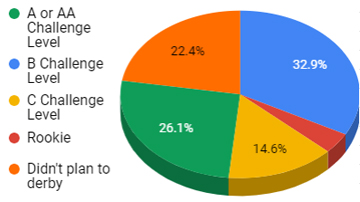
Attendees by Self-Reported Skill level
| A or AA Challenge Level | 26% |
| B Challenge Level | 33% |
| C Challenge Level | 15% |
| Rookie | 4% |
| Doesn’t plan to play derby | 22% |
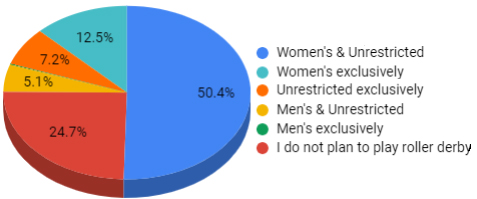
Game Preference:
| Women’s & Unrestricted | 50% |
| Women’s exclusively | 13% |
| Unrestricted exclusively | 7% |
| Men’s & Unrestricted | 5% |
| Men’s exclusively | 0.04% |
| Doesn’t plan to play derby | 25% |
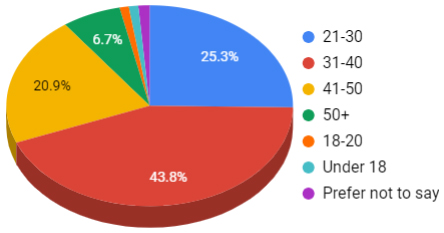
Self-reported Age:
| Under 18 | 1% |
| 18-20 | 1% |
| 21-30 | 25% |
| 31-40 | 44% |
| 41-50 | 21% |
| 50+ | 7% |
| Prefer not to say | 1% |
Favorite Events:
| 32% | Not sure, this is my first year! |
| 21% | It’s all too fun to choose just one!! |
| 19% | Bouts & Challenges |
| 13% | On Skates Training |
| 5% | Social Events & Pool Party |
| 4% | Officiating (& Clinic) |
| 3% | Skate Park |
| 1% | Classroom Seminars |
| 0.6% | Vendor Village |
| 0.3% | Volunteering |
| 0.1% | Off Skates Athletics |
| 0.04% | Social Skates |
For the last three demographic questions (race / ethnicity, gender, and “additional info”), we asked you to write in answers so you could tell us what sort of categories and terms make sense to you.
Race / Ethnicity
About half of you preferred not to answer this question. So this is everyone who did answer (in order of their percentages):
| White/Caucasian | 34.10% |
| Hispanic | 4.56% |
| Mixed/multi-racial/multi-ethnic | 3.98% |
| Mexican (American) | 1.18% |
| Latinx | 1.03% |
| Black | 0.78% |
| Native American | 0.69% |
| African American | 0.72% |
| Asian | 0.63% |
| Filipino | 0.51% |
| Pacific Islander | 0.27% |
| Indigenous | 0.21% |
| Japanese | 0.18% |
| Canadian | 0.15% |
| Australian | 0.15% |
| Italian | 0.12% |
| Hawaiian | 0.12% |
| American | 0.12% |
| Puerto Rican | 0.09% |
| New Zealander | 0.09% |
| Metis | 0.09% |
| Korean | 0.09% |
| Chinese | 0.09% |
| Scottish | 0.06% |
| Middle Eastern | 0.06% |
| Lebanese | 0.06% |
| Jewish | 0.06% |
| Chicanx | 0.06% |
| Alaska Native | 0.06% |
| Trinidadian American | 0.03% |
| Sicilian | 0.03% |
| Romani | 0.03% |
| Portuguese | 0.03% |
| Pakistani | 0.03% |
| Nordic American | 0.03% |
| Finnish | 0.03% |
| Czech | 0.03% |
| Cuban | 0.03% |
| Colombian | 0.03% |
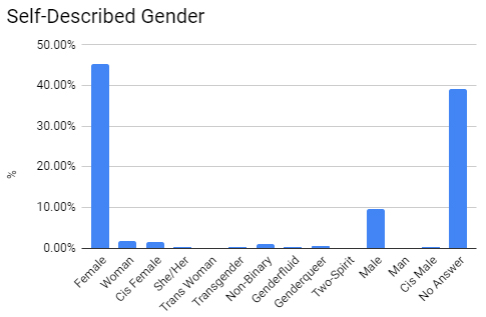
Gender
| Answer | % | Answer | % |
| Female | 45% | Woman | 2% |
| Cis Female | 2% | She / Her | 0.24% |
| Trans Woman | 0.12% | Transgender | 0.21% |
| Non-Binary | 1% | Genderfluid | 0.15% |
| Genderqueer | 0.45% | Two-Spirit | 0.06% |
| Male | 10% | Man | 0.06% |
| Cis Male | 0.36% | No Answer | 39% |
Our last question was: What else do you want to tell us about you? Put that here. 454 of you answered, and you told us a lot of weird and wonderful things. Check out your answers, alphabetically:
RC19 Demographic Info – LAST QUESTION
RollerCon 2018 Demographics
Updated January 2018
This information is 100% from the info passholders give us voluntarily when you purchase your convention pass.
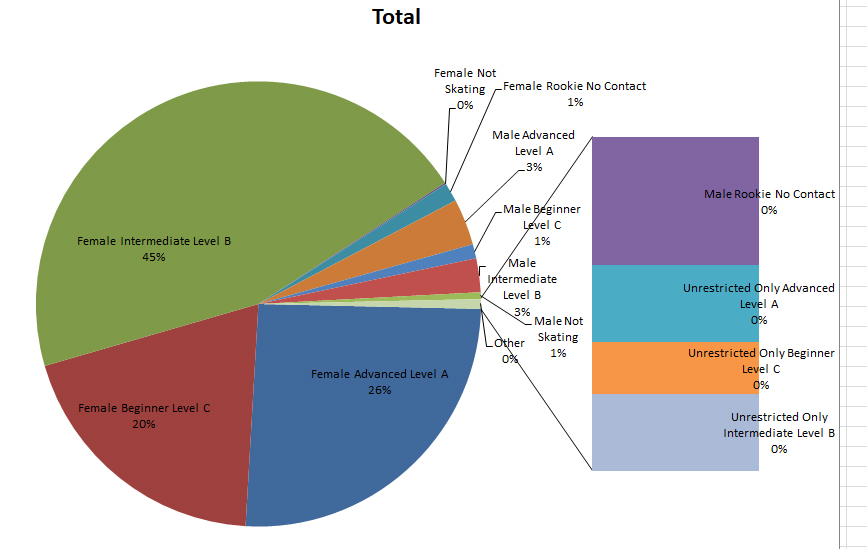
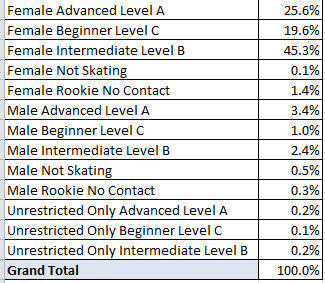
Attendees by self-reported Skill & Gender Identification (as of January 10, 2018)
We use this data to help determine the open scrimmage schedule, the frequency we schedule class levels, and generally to guide scheduling of Challenges. We spend some time talking about Open Scrimmage scheduling on facebook in January, and during the conversation produced this sweet graph!
RollerCon Leadership
Includes all our Department Managers and their Leads that have confirmed that they’re coming back to Leadership for RollerCon 2018 (24 of estimated 30+ total we’ll confirm by summertime):
Our department managers and their leads were not asked for their gender identification, but we did ask if they skated men’s or women’s roller derby:
65% skate Women’s Derby, 13% Men’s and 23% chose neither.
Their ages are:
| 21-30 | 6% |
| 31-40 | 39% |
| 41-50 | 32% |
| no response | 23% |
RollerCon Volunteer Army
includes all our volunteers that earned passes and have already signed up for them, which is about half what we’ll have by this summer – but you can still see trends:
Our volunteer army identifies as:
| Women | 69% |
| Men | 27% |
| Prefer not to say | 3% |
Age groups are:
| 21-30 | 16% |
| 31-40 | 41% |
| 41-50 | 33% |
| 50+ | 9% |
| Told us to mind our own biz | 1% |
RollerCon Attendees
Includes everyone that has purchased passes as of January 10th, 2018, including volunteers:
Where you’re from:
| Australia | 0.6% |
| Belgium | 0.4% |
| Canada | 4% |
| Germany | 0.13% |
| Hong Kong | 0.04% |
| Ireland | 0.04% |
| Republic of Korea | 0.04% |
| Mexico | 0.58 % |
| Netherlands | 0.04% |
| New Zealand | 0.04% |
| Sweden | 0.04% |
| United Kingdom | 1.44% |
| United States | 93% |
83% of you plan to skate at RollerCon. 17% are going to enjoy the convention off skates.
46% of you are interested in volunteering! Thank you so much for that.
46% of you are looking forward to your first RollerCon this year. 54% of you are returning!
85% of you identify as women.
15% of you identify as men.
1% of you prefer not to say.
You told us you are:
| Under 18 | 1% |
| 18-20 | 1% |
| 21-30 | 31% |
| 31-40 | 44% |
| 41-50 | 19% |
| 50+ | 4% |
| prefer not to say | 1% |
Of those of you that are skating, you carry insurance from:
| WFTDA | 83% |
| CRDi | 4% |
| USARS | 4% |
| Event Passes | 9% |
For returning RollerCon attendees, your favorite category of events are:
| Playing in Bouts & Challenges | 33% |
| On Skates Training | 26% |
| Watching Bouts & Challenges | 15% |
| Black n’ Blue Ball & PM Social Events | 7% |
| Seminars & Workshops | 5% |
| Pool Party | 5% |
| Open Skate & Scrimmages | 4% |
| Volunteering | 2% |
| Vendor Village | 2% |